When going live with a big project, it is all about reassuring the client that the project will be able to handle all those excited visitors. To achieve that state of zen, it is paramount that you do a load test. The benefits of load tests go beyond peace of mind, however. For example, it enables you to spot issues that only happen during high load or lets you spot bottlenecks in the infrastructure setup. The added bonus is that you can bask in the glory of your high-performance code - on the condition the test doesn’t fail, of course.
When doing a load test it is important to do the following steps:
- Analyse existing data
- Prepare tests
- Set up tools
- Run the tests
- Analyse the results
Analyse existing data
If you are in luck, you will already have historic data available to use from Google Analytics. If this isn’t the case, you’ll have to get in touch with your client and ask a few to-the-point questions to help you estimate all the important metrics that I’ll be covering in this post.
A couple of tips I can give if you lack the historic data:
- Ask if the client has a mailing (digital or old-school) list and how many people are on it
- If you have made comparable sites in the past, look at their Google Analytics data
- Ask the client how they are going to announce their new website
- When you are working on an estimate, it is always better to add an extra 15% to it. Better safe than sorry!
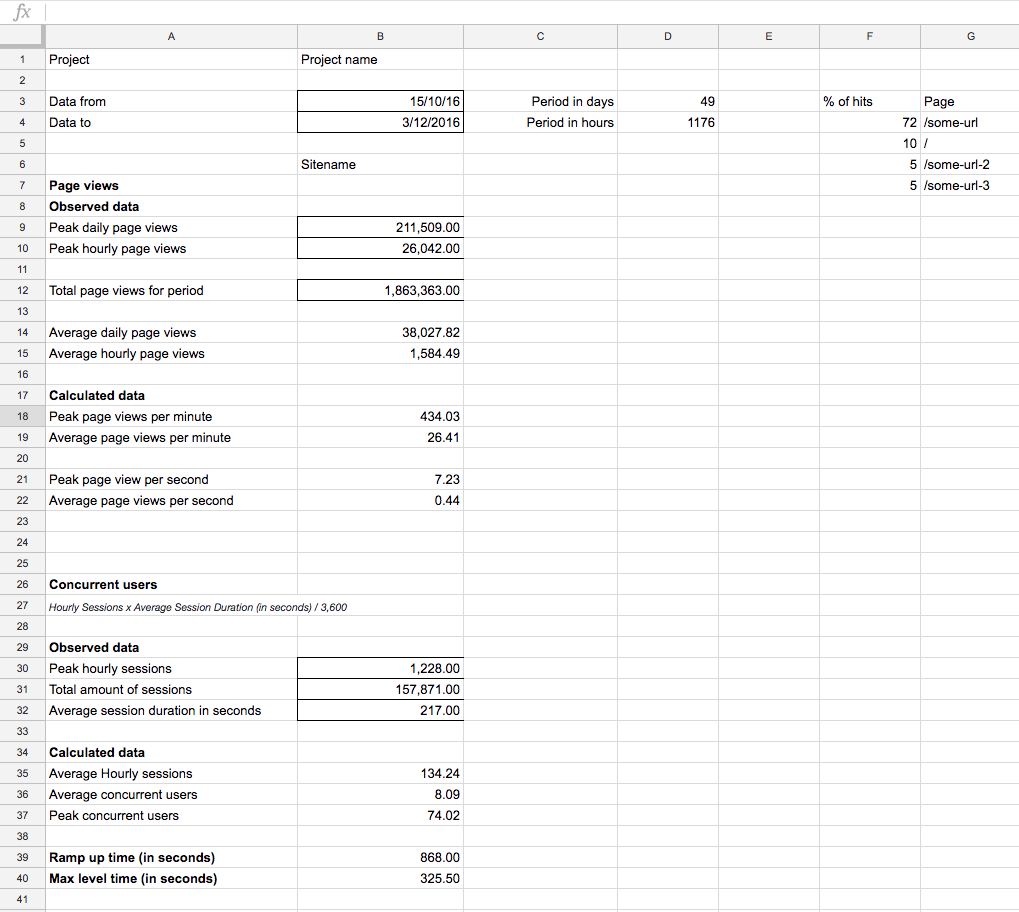
The first thing you need to do, is set a reference frame. Pick a date range that has low activity as well as the highest activity you can find. Then start putting that data into a spreadsheet, as pictured below:
The most important metrics we are going to calculate are:
- Peak concurrent user (Hourly sessions x Average sessions Duration / 3600)
- Peak page views per second
The values you need to find or estimate are:
- Peak daily page views
- Peak hourly page views
- Total page view for period
- Peak hourly sessions
- Total amount of sessions
- Average session duration in seconds
As you can see, we mainly focus on the peak activity, because you test with the worst-case scenario in mind - which is, funnily enough, usually the best-case scenario for your client.
Before we start preparing our test, it is also handy to check which pages receive the most traffic. This benefits the validity of your test scenario.
Prepare the tests
For our tests we are going to start out with Apache JMeter, which you can grab here.
With JMeter you can test many different applications/server/protocol types, but we’re going to use it to make a whole lot of HTTP requests.
Make sure you have the required Java library and go boot up the ApacheJMeter.jar file.
Adding and configuring a Thread Group
Start by adding a Thread Group to your test plan by right clicking your Test plan and selecting Add > Threads (Users) > Thread Group
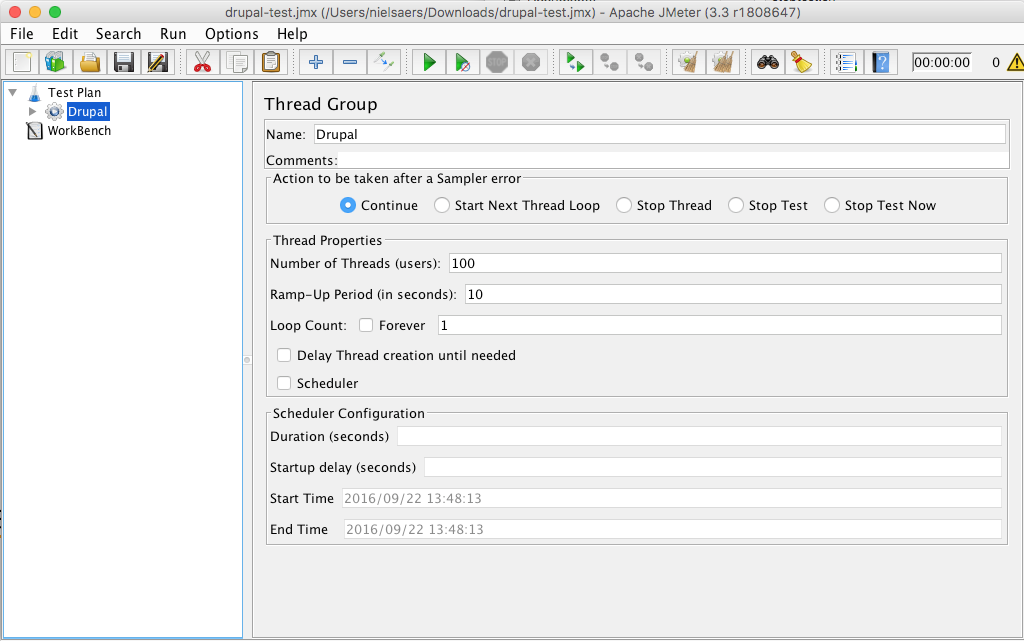
Eventually you will need to fill in the number of (concurrent) users and ramp-up period based on your analysis, but for now keep it low for debugging your test.
Adding and configuring User-Defined Variables
Then right click the thread group to add User Defined Variables (Add > Config Element > User Defined Variables).
Add two variables named url and protocol and assign them a value.
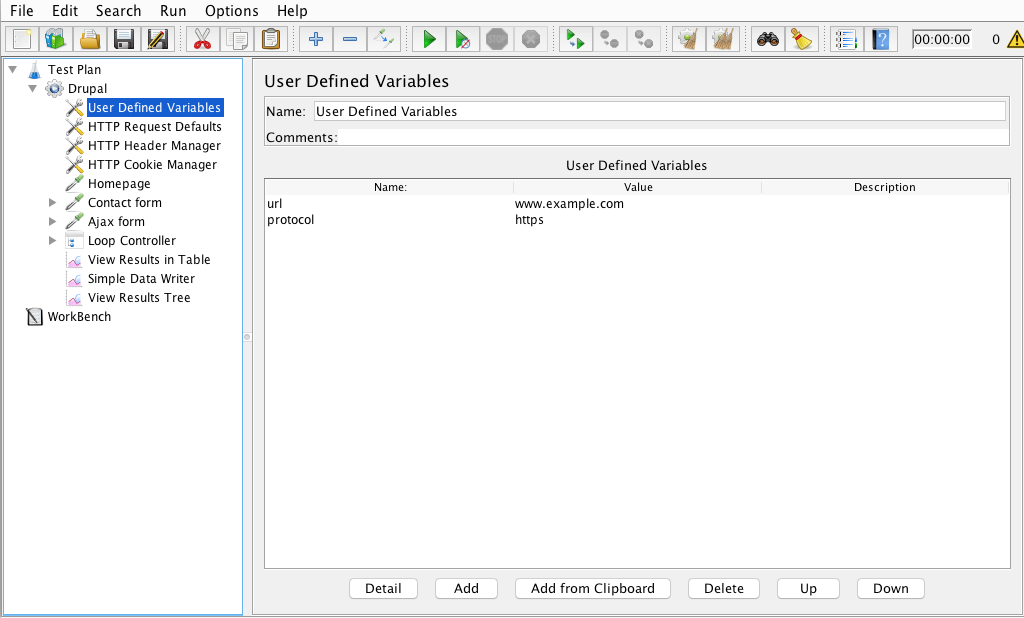
Using these user-defined variables makes it easy to choose another environment to test on. It avoids the painstaking and error-prone work of finding all references and changing them manually.
You can use these variables in input fields in your test by doing this: ${url} or ${protocol}
Adding and configuring HTTP config elements
Next up, you need to add the following HTTP config elements to your thread group:
- HTTP Request Defaults
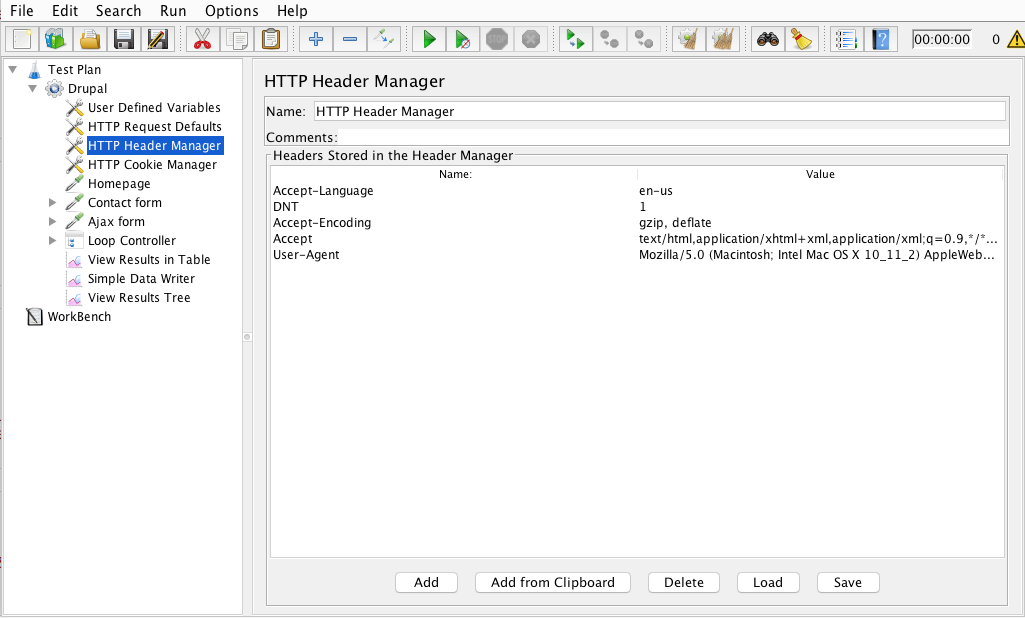
- HTTP Header Manager
- HTTP Cookie Manager
On the first one, you use your variables to fill in the protocol and the server name.
On the second one, you can set default headers for each one of your requests. See the screenshot below for what I’ve put in default.
For the third one, you only select cookie policy: standard.
A simple page request sampler
Right-click your test again and add the HTTP request sampler (Add > Sampler > HTTP Request).
Here we are going to call the home page. The only things you need to set here are:
- Method: GET
- Path: /
We don’t fill in the protocol or server name because this is already covered by our HTTP Request Defaults.
Posting the contact form
In this one we are going to submit the contact form (which is located at example.com/contact), so add another HTTP Request like we did before. Now only fill in the following values:
- Method: POST
- Path: /contact
- Follow redirects: True
- Use KeepAlive: True
In order for Drupal to accept the submit, we need to add some parameters to our post, like this:

The important ones here are form_build_id and form_id. You can manually get the form id because it always stays the same. The form build ID can vary, so we need to extract this from the page. We’ll do this using the CSS/JQuery Extractor (right-click your HTTP Request sampler: Add > Post Processors > CSS/JQuery Extractor)
Configure it like the screenshot below:
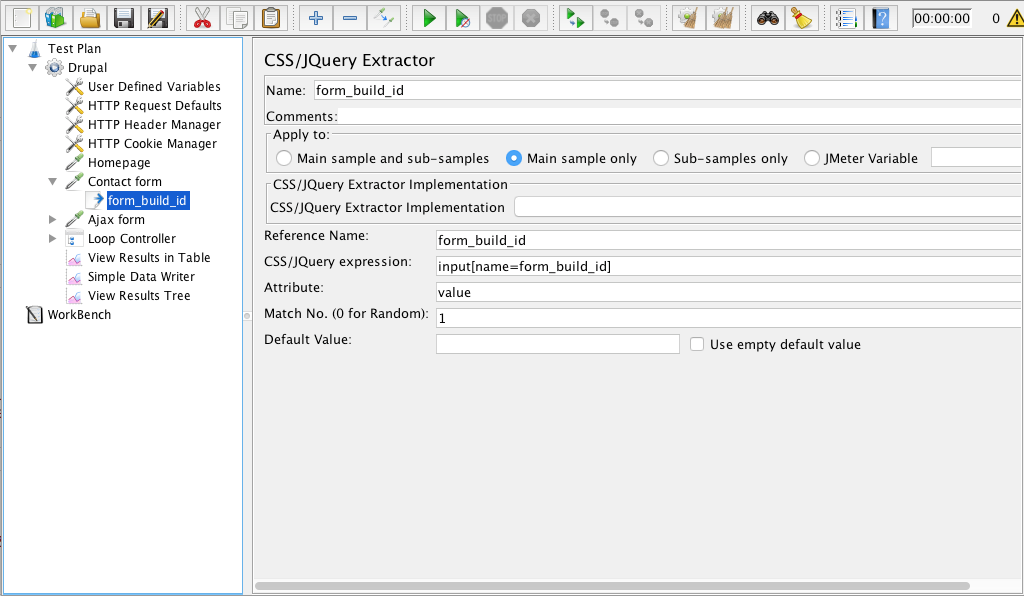
It will now get that form_build_id from the page and put into a variable the sampler can use.$
Posting some Ajax on the form
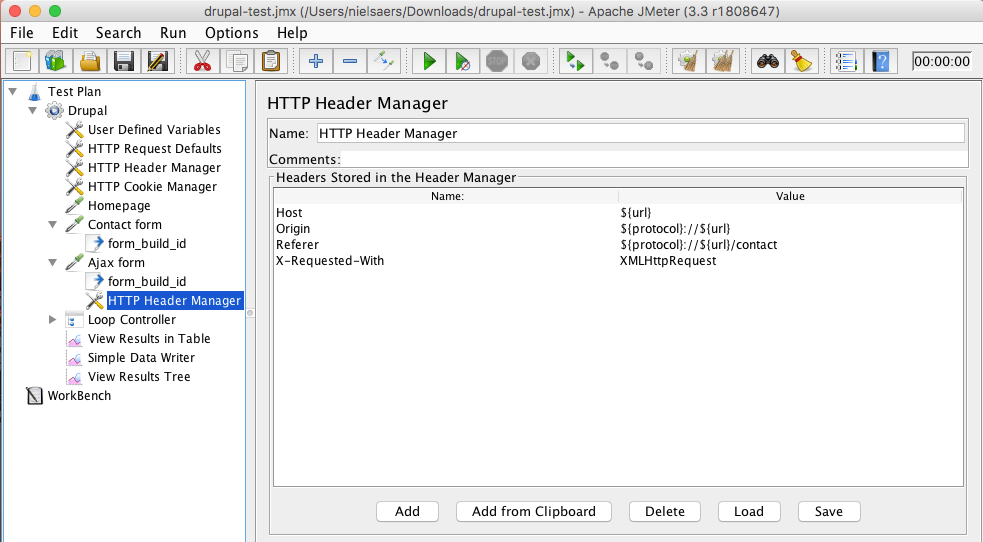
Imagine our contact form has some Ajax functionality and we also want to test this. The way we go about it is identical to posting the regular form like we did before. The only difference is the post parameters, the path and an extra HTTP Header Manager.
You should set the path in your sampler to: /system/ajax
Then right click your sampler to add your new HTTP Header Manager (Add > Config Element > HTTP Header Manager). Configure it like shown in the screenshot:
Saving the results of your test
Now that we’ve configured samplers, we need to add some listeners. You can add these listeners everywhere, but in our example we’ve added it to the test in a whole.
We’ll add three listeners:
- View Results in Table:
- Show every request in a table format
- Handy for getting some metrics like latency and connect time
- Simple Data Writer:
- Writes test data to a file
- Handy for debugging when using Blazemeter (check out this link)
- Just load the file into the View Results Tree
- View Results Tree:
- It shows you the actual response and request.
- Uses a lot of resources (so only good for debugging)
There is a lot more you can do with JMeter. You can read all about it here.
Test-run the test
Now that we’ve configured our test it is time to try it out. So make sure not to put too much concurrent users in there. Just run the test by pressing the green ‘Play’ icon.
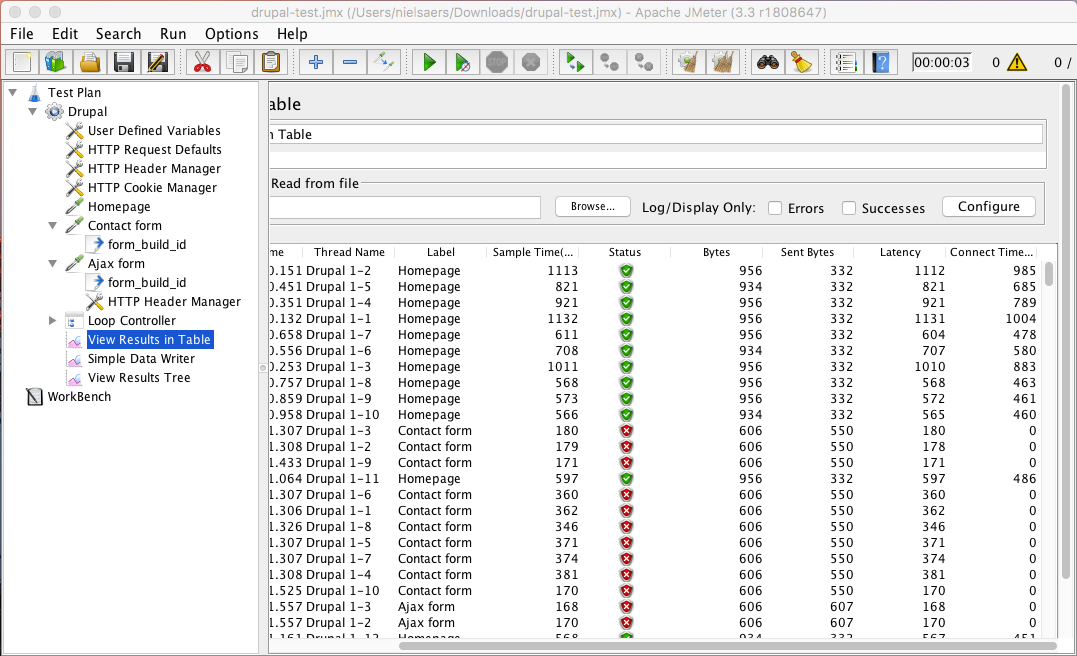
If you get errors, debug them using the feedback you got from your listeners.
As this wise man once said: "Improvise. Adapt. Overcome."
After you’ve validated your test, it’s always handy to turn up the concurrent users until your local site breaks. It’ll give you a quick idea of where a possible bottleneck could be.
Just a small warning: doing that load test on your local machine (running the test and the webserver) will take up a lot of resources and can give you skewed results.
You can download an example here.
Set up tools
Load testing with Blazemeter
When you have a project that will have a lot of concurrent users, your computer is most likely not able to handle doing all those calls and that is why it is good to test from a distributed setup like Blazemeter does.
You can have multiple computers running the same test with only a part of the concurrent users or you can pay for a service like Blazemeter.
The downside of using multiple computers is that they still use the same corporate WiFi or ethernet, blocking yourself possibly to the lowest common denominator, which is most likely unknown and could cause trouble that might skew your test. On top of that you will also have to aggregate all those results yourself, costing you precious time.
To us, the major benefits of Blazemeter are the following:
- Simulate a massive amount of concurrent users with little hassle
- Persistence of test results and comparison between tests
- Executive report to deliver to a technical savvy client
- Sandbox mode tests that don’t count against your monthly testing quota
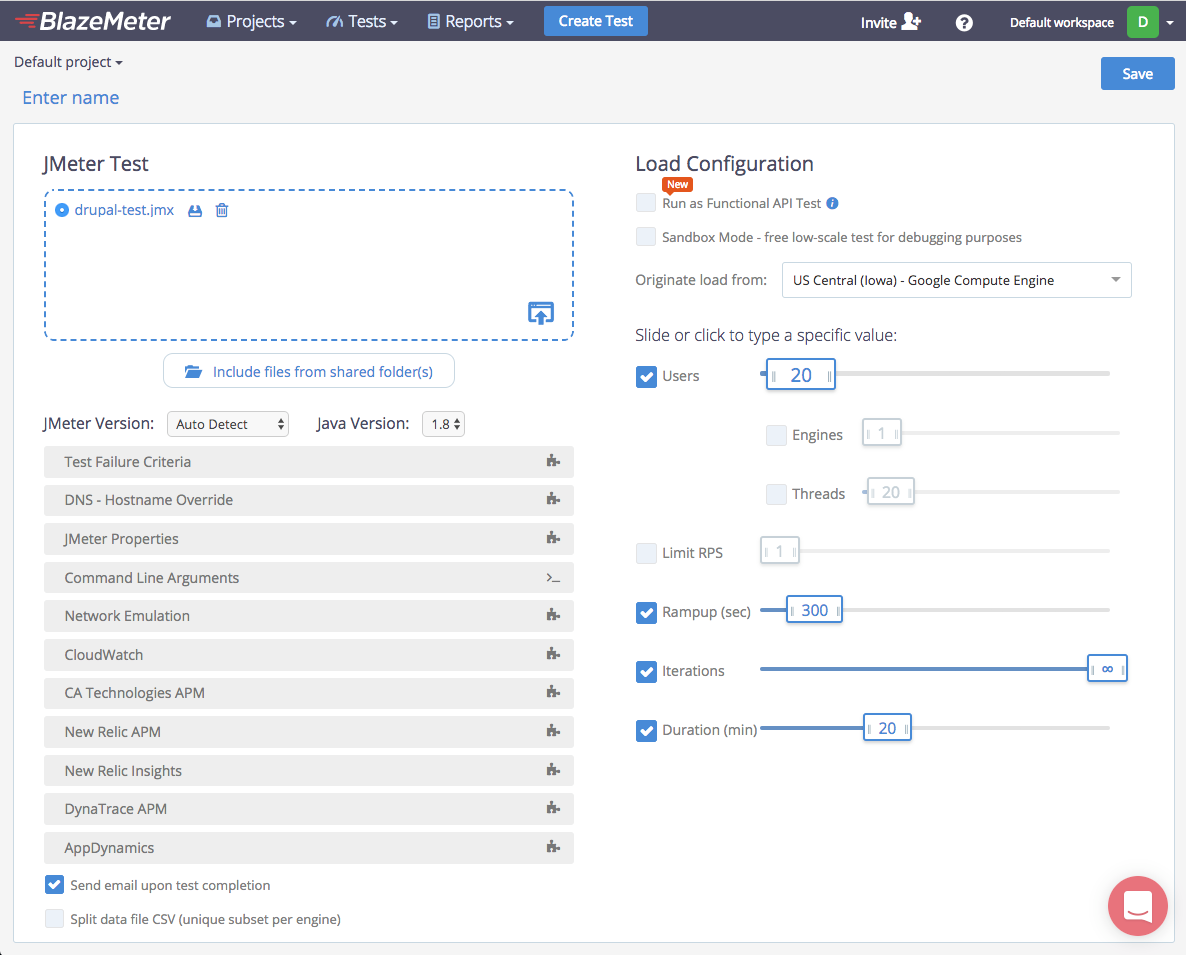
Adding your JMeter test in Blazemeter is very easy and straightforward. Just click ‘Create Test’ in the menu and select JMeter Test.
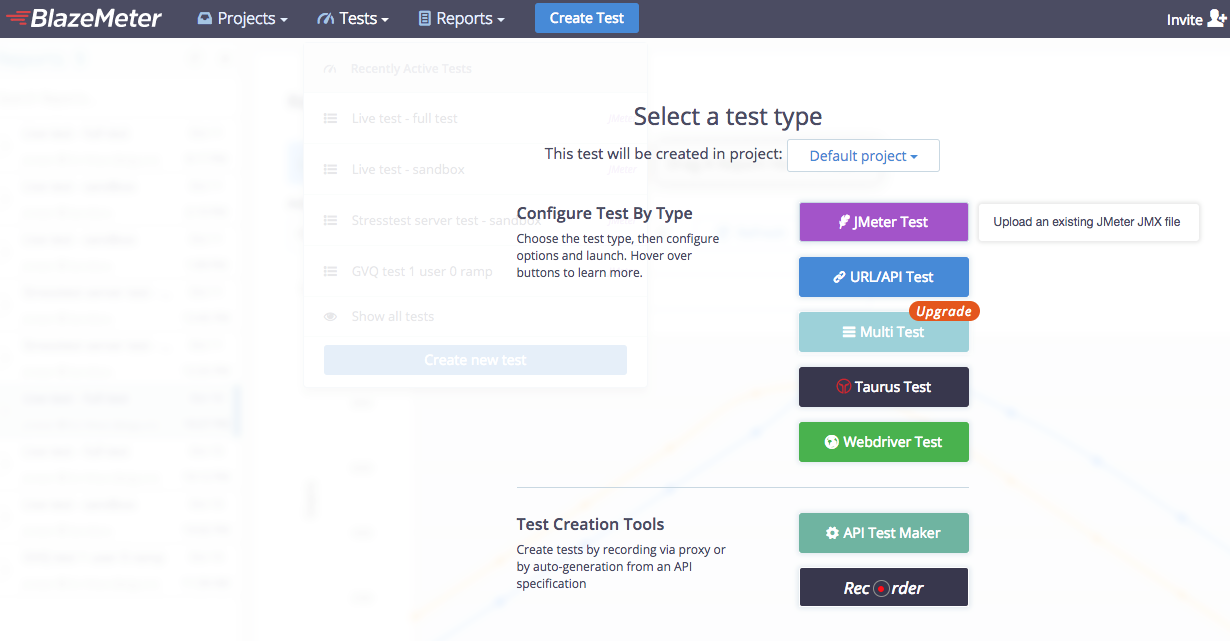
Upload the file and you can start to configure your test to reflect your test scenario from the analysis chapter. We suggest to choose to ‘Originate a load’ from a service that is closest to your target population.
Before you run your test, it is important to have set up your monitoring of the environment you want to test.
Monitoring performance
At Dropsolid, we like to use New Relic to monitor performance of our environments but you could also use open source tools like Munin.
The most important factors in your decision of monitoring tool should be:
- Persistence of monitoring data
- Detail of monitoring data
- Ease of use
If you are using New Relic, we recommend to install both APM and Server. The added value of having APM is that you can quickly get an overview of possible bottlenecks in PHP and MySQL.
Run the test
Now that everything is set up, it is important to have an environment that is a perfect copy of your production environment. That way you can easily optimize your environment without having to wait for a good moment to restart your server.
Run your test, sit back and relax.
Analyse the results
If everything has gone according to plan, you should now have reports from both Blazemeter and New Relic.
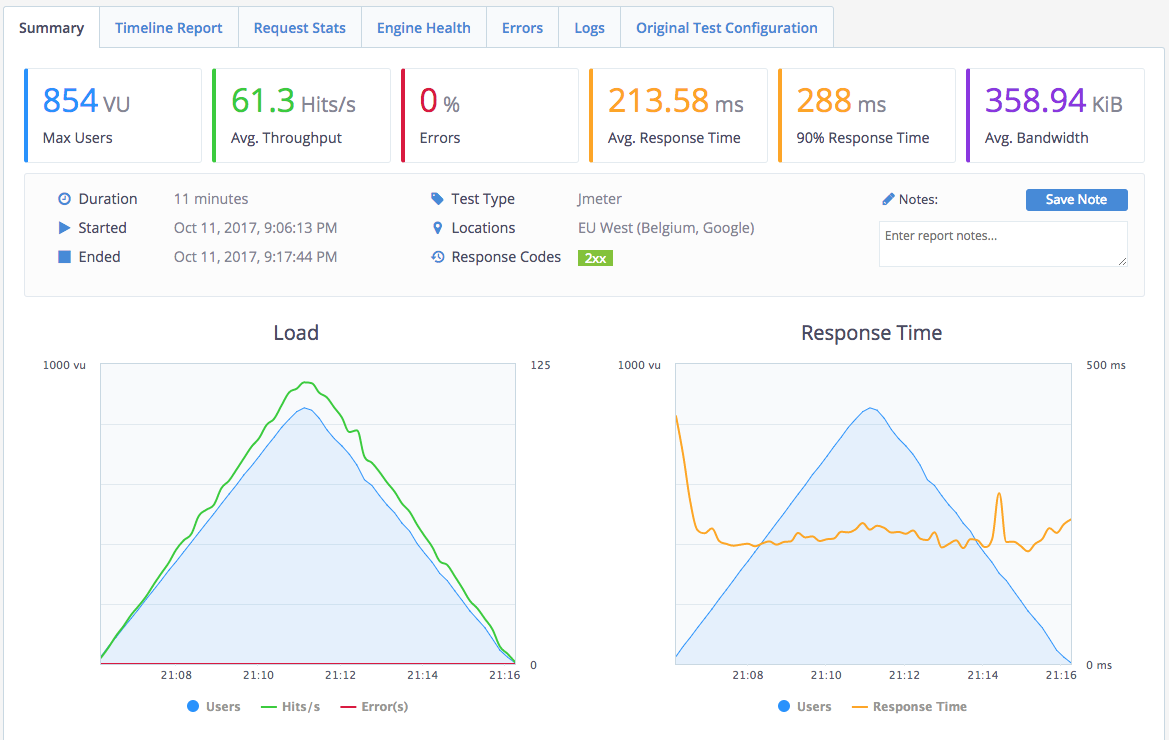
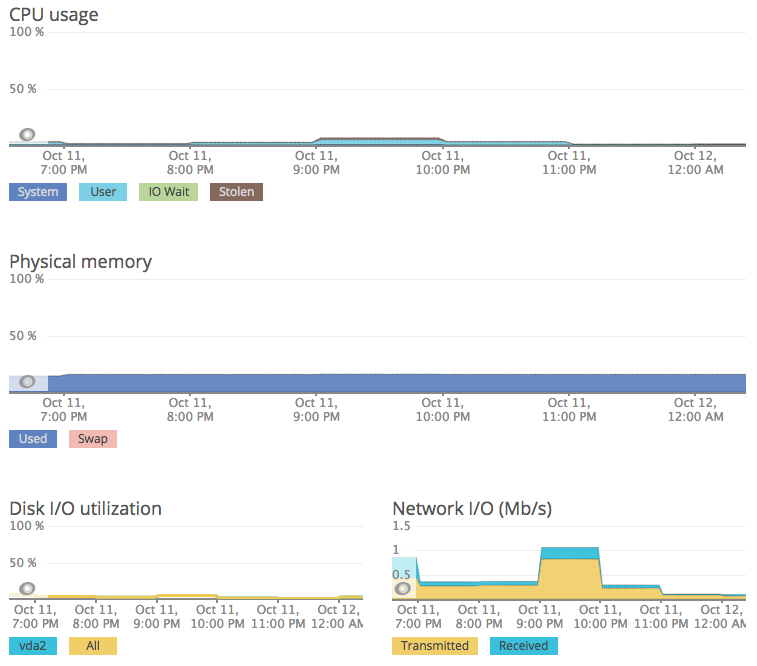
If your server was able to handle the peak amount of users, then your job is done and you can inform the client that they can rest assured that it won’t go down.
If your server couldn’t handle it, it is time to compare the results from Blazemeter and New Relic to find out where your bottleneck is.
Common issues are the following:
- Not the right memory allocation between parts of the stack.
- Misconfiguration of your stack. For example, MySQL has multiple example configuration files for different scenarios
- Not using extra performance enhancing services like varnish, memcache, redis,...
- Horrible code
If the issue is horrible code, then use tools like xhprof or blackfire.io to profile your code.
Need expert help with your performance tests? Just get in touch!
Final note
As Colin Powell once said: "There are no secrets to success. It is the result of preparation, hard work and learning from failure." That is exactly what we did here: we prepared our test thoroughly, we tested our script multiple times and adapted when it failed.